Help Page
Overview
PGCC Explorer is an interactive web platform that accelerates research on polyploid giant cancer cells (PGCCs), which are key contributors to therapy resistance, by giving you direct access to our single-cell morphological screening dataset from six cancer cell lines spanning three major cancer types (breast, pancreatic, and prostate cancer) and integrating it with multi-omic profiles (mutations, copy number alterations, gene expression, and pathway activities). The tool supports two complementary discovery modes: a gene/pathway-centric search to find anti-PGCC compounds influenced by specific genomic features, and a compound-centric search to reveal genomic determinants of anti-PGCC efficacy for a given drug. By linking PGCC-specific effects to molecular context, PGCC Explorer helps users generate hypotheses, prioritize candidates, and identify potential biomarkers for precision therapies.
Tool Design and Usage
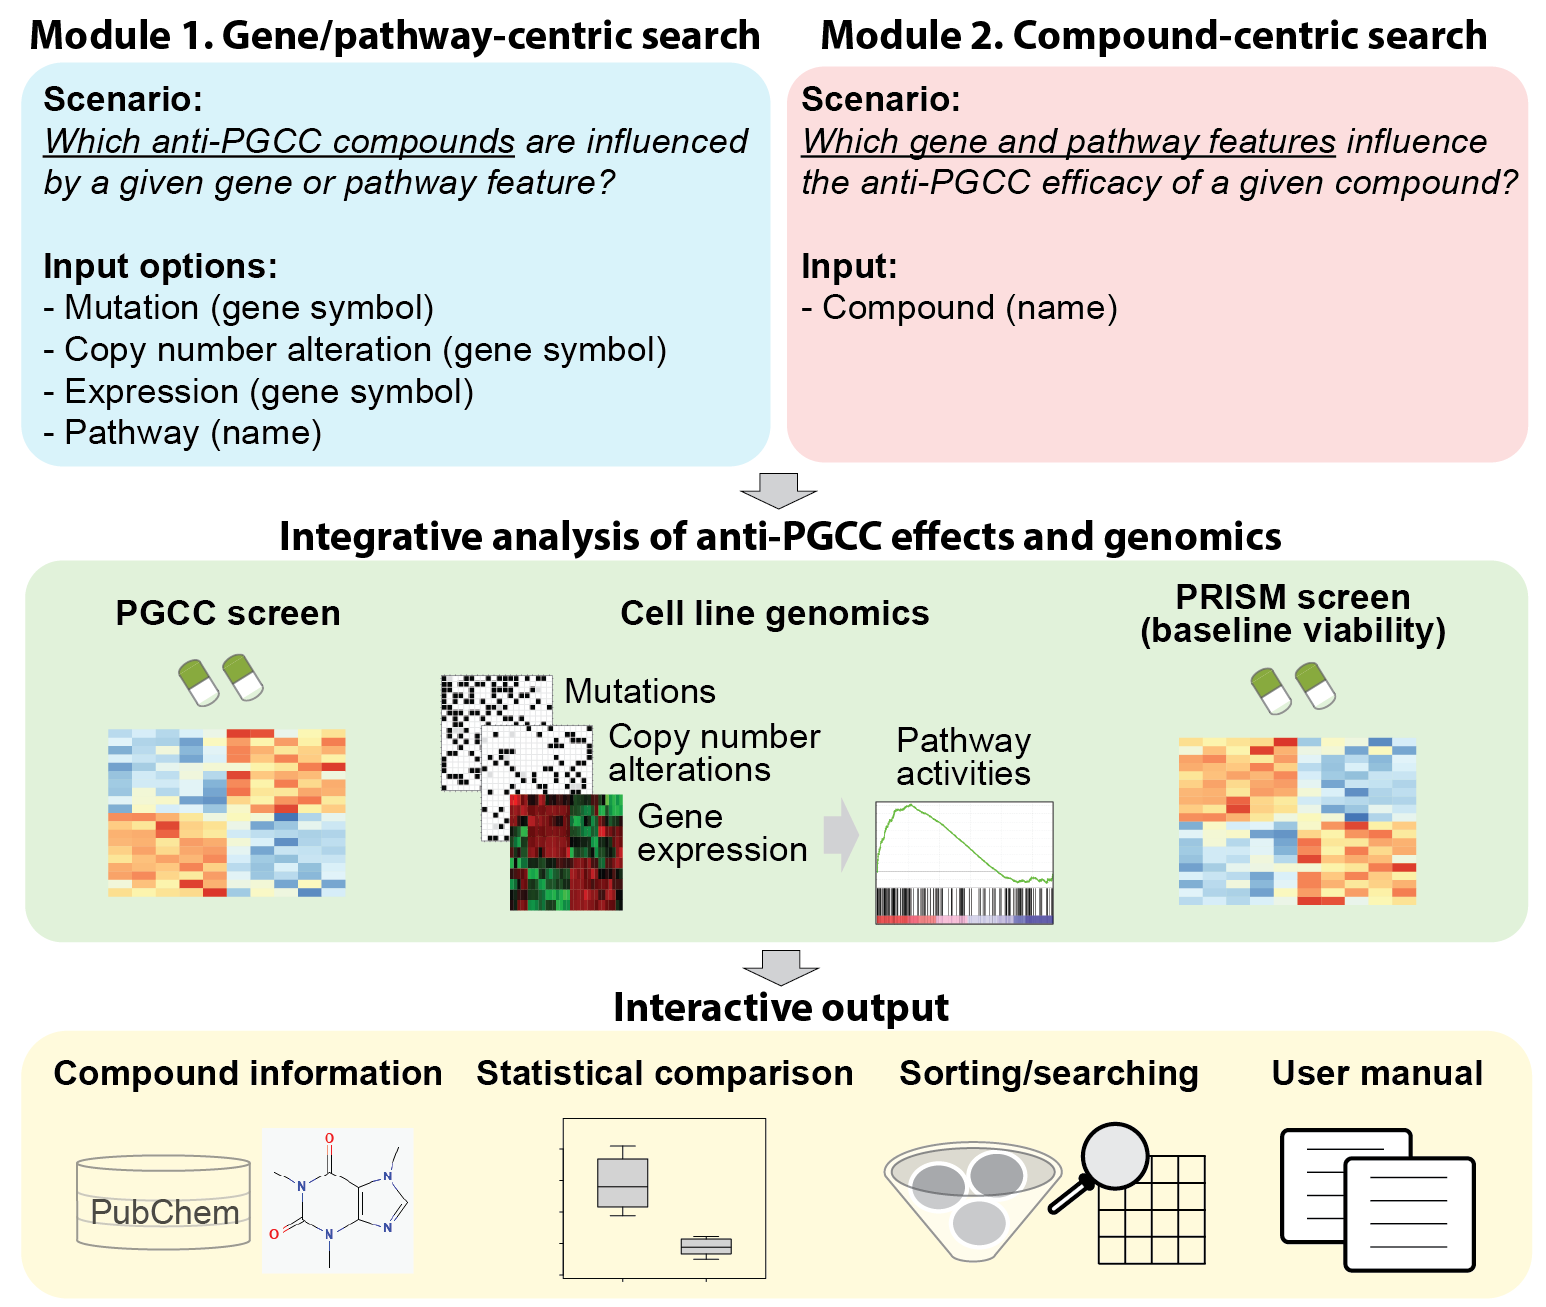
Module 1. Gene/Pathway-centric search (Which anti-PGCC compounds are influenced by a given gene or pathway feature?)
Input options
- Mutation: Select a gene and compare anti-PGCC responses between mutated and wild-type cell lines.
- Copy number alteration: Select a gene and explore compound effects based on copy-number gain, loss, or neutral status.
- Expression: Select a gene and rank compounds by differential efficacy between high- and low-expression groups of the gene.
- Pathway: Select a canonical pathway or GO biological process to evaluate responses between high and low pathway activity levels.
Outputs
- Sortable tables ranking all compounds by differential anti-PGCC activity across feature-defined groups.
- Clickable drug cards with detailed information and PGCC response distributions.
- Interactive visualizations (e.g., box plots) showing responses by genomic or pathway categories.
- Statistical results from two-tailed t-tests quantifying the significance of observed differences.
Module 2. Compound-centric search (Which gene and pathway features influence the anti-PGCC efficacy of a given compound?)
Input options
- Compound: Select any drug from the screening library to identify gene and pathway features most strongly associated with its anti-PGCC efficacy.
Outputs
- Ranked gene expression and pathways correlated with drug efficacy.
- Box plots comparing PGCC responses across feature-defined groups for the selected compound.
- Statistical summaries (two-tailed t-test results) supporting the observed associations.
- Interactive panels and detailed compound metadata for in-depth exploration.
Methods: High-throughput PGCC Screen
The dataset in PGCC Explorer was generated using a scalable, single-cell imaging pipeline applied to six human cancer cell lines (MDA-MB-231, MCF7, SKBR3, Panc-1, SUM159, and PC3). Cells were cultured using standard protocols and plated into 96-well plates at 1,000-4,000 cells per well.
Compound Library & Dosing
- A total of 2,726 compounds from the APExBIO DiscoveryProbe™ Clinical & FDA-Approved Drug Library (L1052), each with Phase I safety evaluation, were screened at 10 µM. Of the screened compounds, 29 were excluded due to intrinsic fluorescence interfering with image processing, and 6 duplicative compounds were consolidated into single entries. As a result, a total of 2,691 compounds were analyzed.
- Compounds were prepared at 10 mM in DMSO or PBS and diluted for treatment; cells were exposed for 48 hours.
Primary Readouts
- Single-cell counts of PGCCs and non-PGCCs per condition and cell line, normalized as log2(treated/untreated).
Plate Setup & Automation
- Cells were harvested with 0.05% Trypsin/EDTA, centrifuged, resuspended, and dispensed into 96-well plates.
- An automated liquid-handling system loaded cells, drugs, and stains in <10 seconds per well, enabling 88 experimental and 8 control wells per plate.
PGCC Pre-induction Arm
- To model therapy-induced PGCCs, a parallel arm pre-treated cells with 1 µM Paclitaxel for 48 hours before adding test compounds for an additional 48 hours.
Staining & Imaging
- Post-treatment staining used 0.3 µM Calcein AM, 0.6 µM Ethidium homodimer-1, and 8 µM Hoechst 33342 with a 30-minute incubation prior to imaging.
Single-cell Analysis Pipeline
- Nucleus identification from Hoechst channel images.
- Cell viability assessment using live/dead staining.
- PGCC recognition based on nuclear-size thresholds, following prior work.
Quality Control
- Twenty-nine compounds were excluded due to intrinsic fluorescence that interfered with image processing.
Methods: External Multi-omics and Screening Datasets
To contextualize PGCC-specific drug responses, PGCC Explorer integrates multi-omics and baseline viability datasets from the Cancer Dependency Map (DepMap) project of the Broad Institute. Together, these datasets enable PGCC Explorer to link drug efficacy with genomic and pathway features, supporting the discovery of candidate biomarkers and mechanisms underlying PGCC vulnerability or resistance.
Multi-Omics
- Mutations: Damaging mutations (missense/nonsense, frameshift, splice-site) in 157 genes were annotated using OncoKB and Ensembl VEP. Mutations were encoded as binary features, requiring >=2 cell lines in both mutant and wild-type groups.
- Copy number variation (CNV): Relative copy number profiles of 12,231 genes from whole-genome sequencing were classified as amplification (>=1.5), deletion (<=0.75), or neutral.
- Gene expression: RNA-seq profiles of 18,026 protein-coding genes were quantified as log2(TPM+1). Genes with zero expression in >=4 cell lines were excluded, leaving 16,498 genes for analysis.
- Pathway activity: Single-sample gene set enrichment analysis (ssGSEA, via GSEApy) transformed baseline expression data of each cell line into pathway activity scores across GO Biological Processes and canonical pathways (BioCarta, KEGG, PID, Reactome, WikiPathways from MSigDB).
Baseline Viability Screen (broad cytotoxic effects on cell lines)
- PRISM Repurposing dataset: To provide baseline anti-proliferative context, PGCC Explorer incorporates PRISM (24Q2 release), a pooled-cell-line viability screen of 6,790 drugs across 920 cancer cell lines. Cell viability is reported as log2-fold change relative to vehicle, with more negative values indicating greater sensitivity. By integrating PRISM with PGCC-specific results for 1,635 overlapping compounds (matched by PubChem CID), the tool helps distinguish PGCC-selective inhibitors from broadly cytotoxic agents.
Funding & Acknowledgments
We gratefully acknowledge the following support for the PGCC screen and web portal.
UPMC Hillman Cancer Center
Internal funding supported partially by NIH P30CA047904.
Ovarian SPORE
Supported by P50CA272218.
NIH / NCI
R00CA248944 and R21CA293424.
NIH Office of the Director
3R00CA248944-04S1, R03CA305794, and R03DE033361.
University of Pittsburgh Center for Research Computing and Data
Computational and IT resources to support the hosting of this web tool, partly supported by NIH S10OD028483.